 Filter: Year of 1800-1899
Filter: Creator Name of Lapham, Increase Allen
Filter: Year of 1860-1869
Filter: Year of 1800-1899
Filter: Creator Name of Lapham, Increase Allen
Filter: Year of 1860-1869
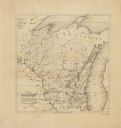
| Date: | 1865 |
|---|---|
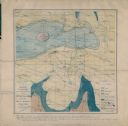
| Description: | Map showing the location of meteorological stations and effects that Lake Michigan has had on Wisconsin temperatures in January and July. The map shows cou... |
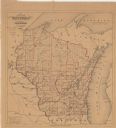
| Date: | 1865 |
|---|---|
| Description: | This map shows county boundaries, outlined in red. Each county's population is handwritten in the margins. The map also includes towns, rivers and lakes. |
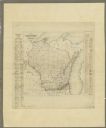
| Date: | 1866 |
|---|---|
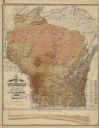
| Description: | This thematic shows the effects that Lake Michigan has had on Wisconsin mean temperatures in January and July. The map shows counties, some cities, rivers ... |
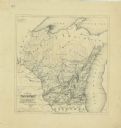
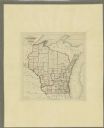
| Date: | 1865 |
|---|---|
| Description: | This map shows the population density per square mile in the entire state, showing southeastern and southern Wisconsin had the greatest population density ... |
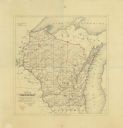
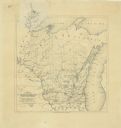
| Date: | 1865 |
|---|---|
| Description: | Drawn the last year of the Civil War, this thematic map shows the effects that Lake Michigan has had on Wisconsin temperatures in January and July. The map... |
| Date: | 1867 |
|---|---|
| Description: | Map of the entire state indicates county boundaries outlined in red, cities of over 3000 inhabitants and county seats. It also marks rivers and lakes. |
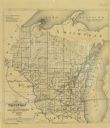
| Date: | 1868 |
|---|---|
| Description: | This map of the entire state shows county boundaries outlined in red, cities of over 3000 inhabitants and county seats. It also marks rivers, lakes, railro... |
| Date: | 1868 |
|---|---|
| Description: | Prepared for the State Board of Emigration in 1868, this map shows county boundaries, some cities, and completed and projected railroads. |
| Date: | 1869 |
|---|---|
| Description: | This geological map shows the township grid, counties, cities and villages, rivers, lakes, railroads, and roads. Barron County is still labeled Dallas Coun... |
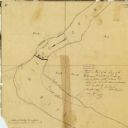
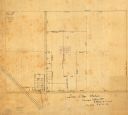
| Date: | 07 1868 |
|---|---|
| Description: | A hand-drawn map of a portion of Jackson County, Wisconsin between Township No. 21 north, range number 4 West and township no. 21 north, range no. 3 west, ... |
| Date: | 1867 |
|---|---|
| Description: | This 1867 manuscript map by Increase Lapham shows the topography and geology of the Blue Mounds region in the Town of Brigham in Iowa County and the towns ... |
| Date: | 1864 |
|---|---|
| Description: | This map is pen and watercolor on paper and shows profile and geological formation of Blue Mound and location of Arnold’s Hotel and Brigham Lead Mines. |
| Date: | 1866 |
|---|---|
| Description: | This manuscript map by Increase Lapham shows the Dells of the Wisconsin River, from Stand Rock and Witches Gulch at the north to a point approximately one ... |
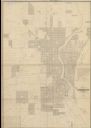
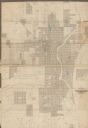
| Date: | 1861 |
|---|---|
| Description: | Map with labelled block and lot numbers, owners of large property parcels, city wards, railroads, and streets. Population from 1835 to 1860 listed below ti... |
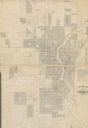
| Date: | 1863 |
|---|---|
| Description: | Includes index to public buildings, churches, schools. Inset: Glidden & Lockwood’s addition. Gives names of some property owners. |
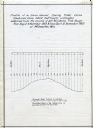
| Date: | 12 1860 |
|---|---|
| Description: | Graph showing the profile of a semi-diurnal spring tidal curve deduced from 5452 half hourly ordinates obtained from the records of self registering tide g... |
| Date: | 1868 |
|---|---|
| Description: | This map is ink on tracing cloth and shows lot and block numbers, depot, railroads and side tracks, and streets in sections 24 and 25, T.11, R.16E. The map... |
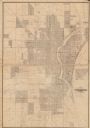
| Date: | 1868 |
|---|---|
| Description: | This map shows lot and block numbers, some property ownership, wards, roads, and railroads. An inset map shows the Glidden & Lockwood’s addition. There are... |
| Date: | 1869 |
|---|---|
| Description: | This map shows lot and block numbers, some property ownership, wards, roads, and railroads and includes inset map of Glidden & Lockwood’s addition. There a... |
| Date: | 1868 |
|---|---|
| Description: | This map is one of the earliest weather maps of the United States, which traced an 1859 storm across the continent. Manuscript annotations in red ink show ... |
If you didn't find the material you searched for, our Library Reference Staff can help.
Call our reference desk at 608-264-6535 or email us at: